|
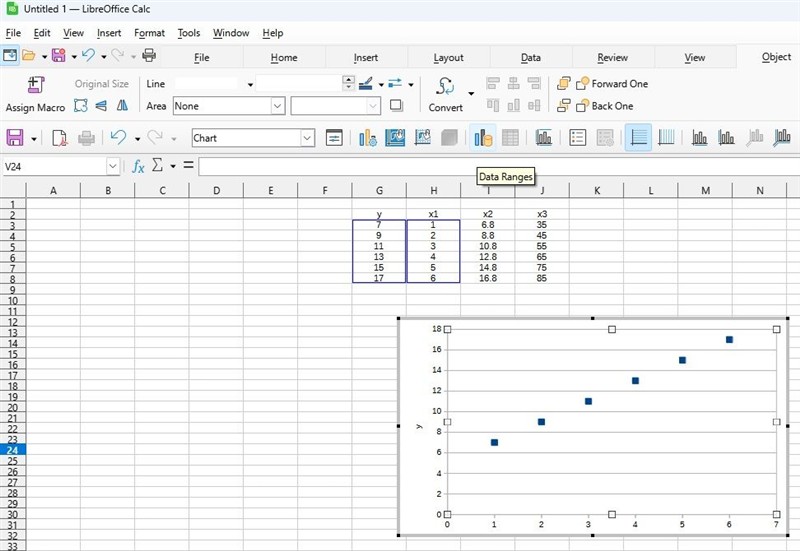
SE MN | After creating an XY scatter graph using data from a spreadsheet, I like to quickly change the x axis data range from one column to the next to see how each column interacts with the y data. This is easily done in Excel. In LibreOffice Calc, it seems I have to manually select the x axis data range each time I want to change (click data ranges icon>>x-values>>click the select button>>highlight the new data range). This is very slow when trying to look through many potential x axis columns. How can I drag the blue rectangle in the photo below in Calc? (In the picture below I want to drag the 2nd blue outline from H3:H8 to J3:J8.) The photo below is a generic example, not actual data.
 (graphing (full).jpg) (graphing (full).jpg)
Attachments
----------------
 graphing (full).jpg (92KB - 11 downloads) graphing (full).jpg (92KB - 11 downloads)
| |
|
 Data range modification on LibreOffice Calc chart

